Log forwarding
Understand how OpsChain's log aggregator works and, if required, configure it to forward build, change and workflow run logs to external log storage. After following this guide you should know how to:
- add plugins to the OpsChain log aggregator
- configure build, change and workflow run logs to be sent to external log storage
Introduction
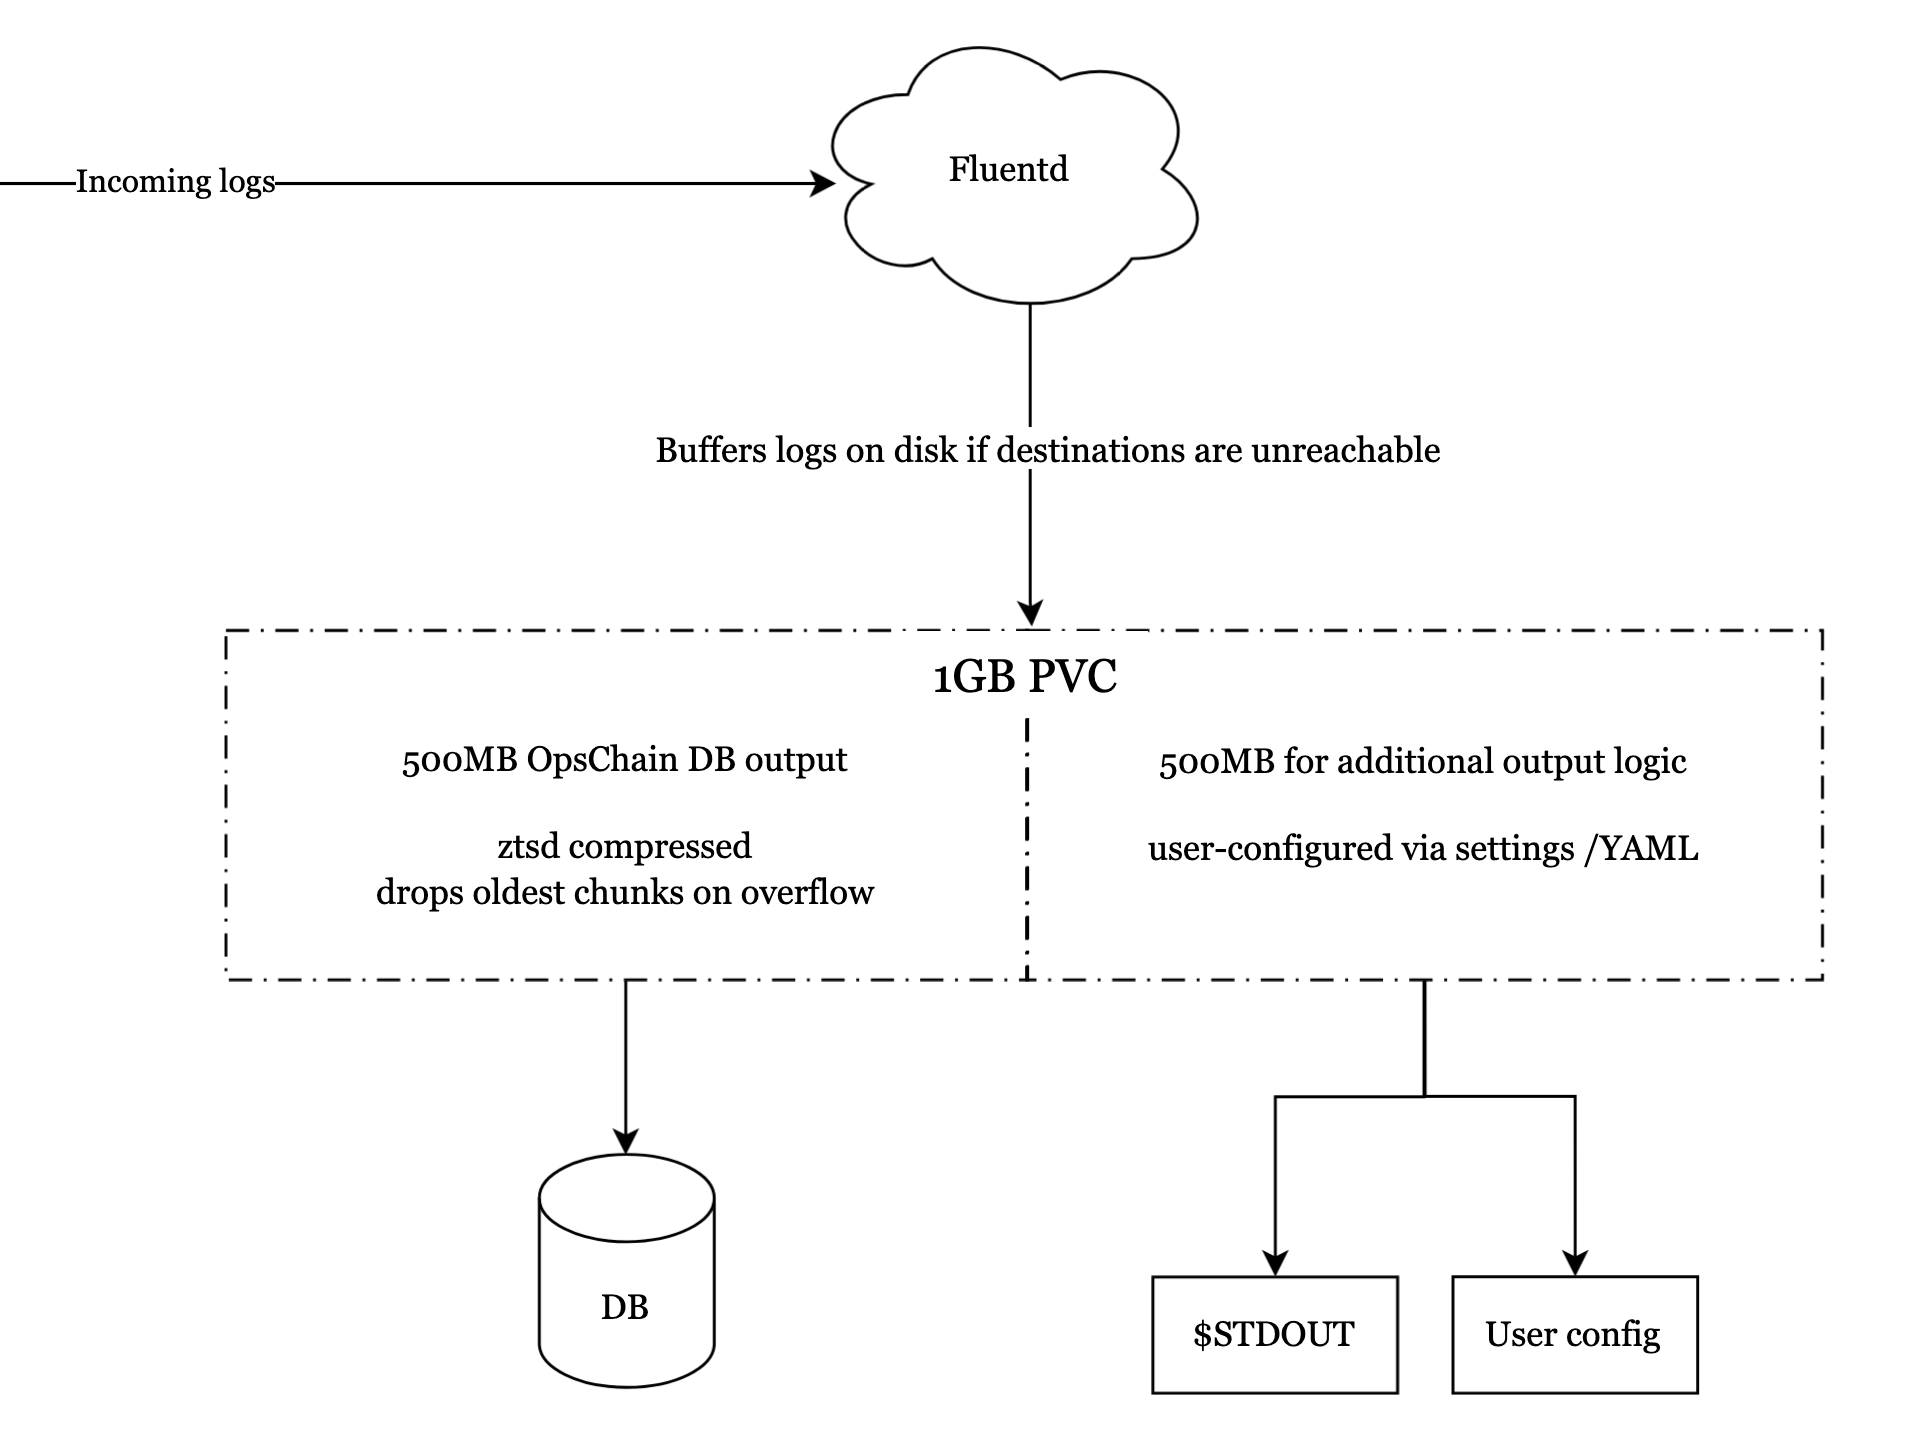
OpsChain uses Fluentd as its log aggregator. Fluentd provides an extensive framework that allows for custom developed and pre-built plugins to be used to forward logs to external log storage solutions. This guide describes the capabilities of OpsChain's log aggregator and provides the steps on how to configure OpsChain to forward build, change and workflow run logs to a Splunk HTTPS Event Collector.
Capabilities
OpsChain's log aggregator is provided with a shared 1GB PVC for buffering logs, of which half (500MB) is reserved for buffering logs for OpsChain's internal logging infrastructure. The other half of the log aggregator's buffer is left for you to use for your additional outputs. Refer to Fluentd's buffer configuration guide on how to configure the buffer for your outputs.
If you need to increase the PVC size, you can do so by modifying your values.yaml file and setting the logAggregator.volume.size value to the desired size and (re)deploying MintPress.
logAggregator:
  volume:
    size: 2Gi
For example, to configure the buffer for the Splunk output plugin, dropping oldest chunks on an overflow and compressing the chunks using zstd, use a configuration similar to the example below:
  <store>
    @type splunk_hec

    host splunk.myco.com
    port 8088
    token <Splunk HEC token>
    use_ssl false

    <buffer>
      @type file
      path /fluentd/buffer/my-company/splunk

      retry_forever true
      total_limit_size 100MB
      overflow_action drop_oldest_chunk
      compress zstd
    </buffer>
  </store>
It's up to you to ensure your configuration is valid. Please refer to Fluentd's config file syntax guide for more information.
You can check the log aggregator's logs for errors by running the following command:
kubectl logs -n ${KUBERNETES_NAMESPACE} deployment/opschain-log-aggregator -f
Automated restarts
OpsChain will automatically restart the log aggregator deployment if it's stuck or unresponsive.
While Fluentd is down, no matter the reason, OpsChain will not start any agents, builds, changes or workflow runs.
If Fluentd never recovers, you can check its logs and events to investigate the issue.
OpsChain's internal logging infrastructure
OpsChain's logging configuration sends logs to MintPress's database and will buffer logs in the shared PVC, zstd compressed, until it is able to successfully flush them.
When there is a buffer overflow, OpsChain's internal behaviour is to drop the oldest logs.
Configure additional outputs
MintPress provides multiple options to configure additional outputs for Fluentd, choose the one that best suits your needs.
However you decide to configure the additional outputs, the configuration will be stored in a Kubernetes ConfigMap and mounted into the log-aggregator pod at runtime. You'll need to supply the entire <store></store> string of your configuration to this setting.
The configuration you provide to these settings will be read by Fluentd in the context of the copy output plugin which MintPress takes advantage of to send the MintPress logs to multiple outputs.
Under the copy configuration, each <store> directive added instructs Fluentd to send the log entry to an additional target.
The specific configuration to include in additionalOutputConfig will depend on the plugin @type used. Please see Fluentd's config file syntax guide, and the relevant plugin manual for further information.
Via settings - post-installation
You can configure MintPress settings pre-installation via Helm chart or post-installation via the UI configuration page.
Using the UI configuration page - post-installation
The simplest way to manage additional outputs is via MintPress's UI configuration page. For example, to enable sending the logs to Splunk, just paste the entire <store></store> section into the setting and save.
  <store>
    @type splunk_hec

    host splunk.myco.com
    port 8088
    token <Splunk HEC token>
    use_ssl false
  </store>
After the settings are applied, restart the log-aggregator deployment for the additional configuration to take effect.
kubectl rollout restart deployment opschain-log-aggregator -n ${KUBERNETES_NAMESPACE}
Via Helm chart - pre-installation
The MintPress Helm chart allows you to provide the additional configuration via the logAggregator.additionalOutputConfig value before installing MintPress. An example configuration is provided below:
logAggregator:
  additionalOutputConfig: |-
    <store>
      @type splunk_hec

      host splunk.myco.com
      port 8088
      token <Splunk HEC token>
      use_ssl false
    </store>
When this method is used, the configuration will not appear in MintPress's UI configuration page. You can check the ConfigMap to verify the configuration that is being applied.
kubectl get configmap opschain-log-aggregator-additional-output-config -n ${KUBERNETES_NAMESPACE} -o jsonpath='{.data.output\.conf}'